Master Intraday Trading with Market Structure

Unlock the Secrets to Consistent Gains & Trade Like a Pro

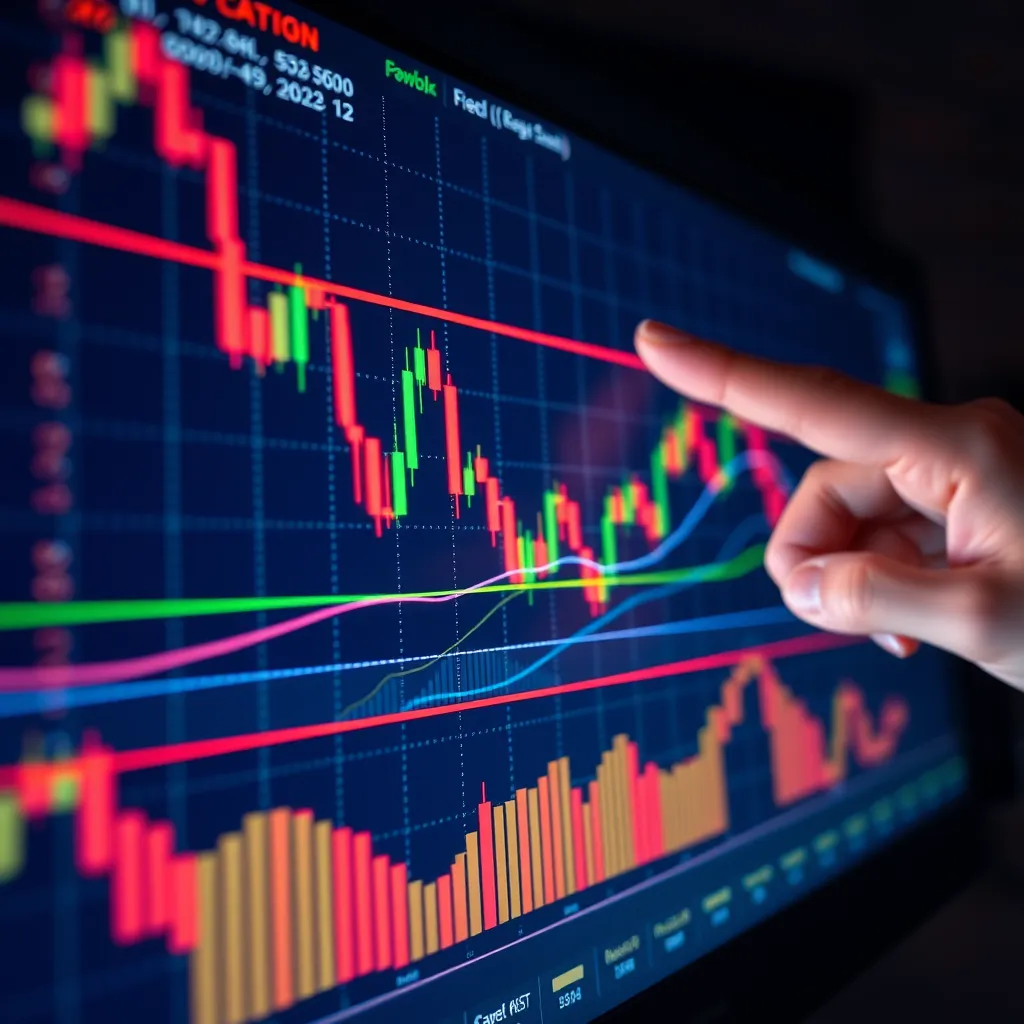
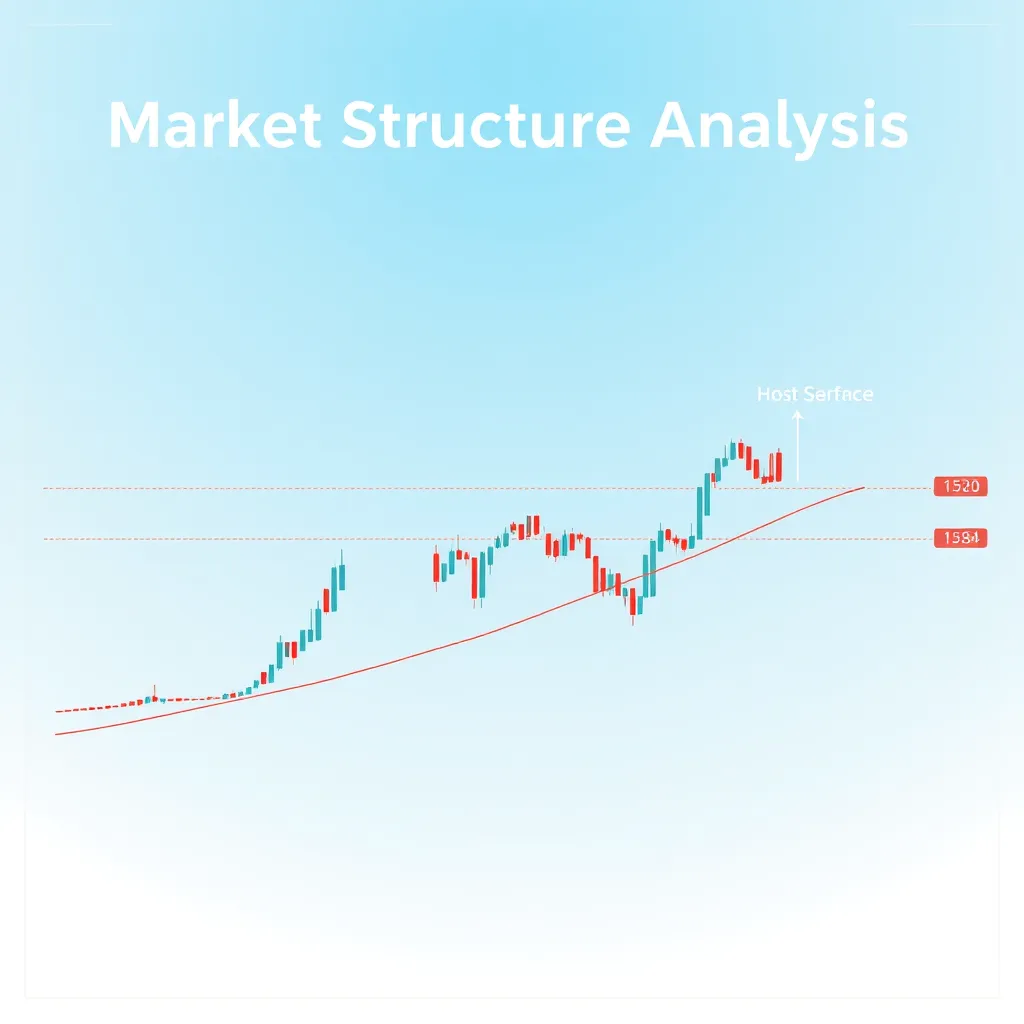
Master Intraday Trading with Market Structure Analysis

A futuristic trading room with a large screen displaying a dynamic chart showing upward and downward trends, with various technical indicators highlighted. The room is filled with advanced technology and a trader analyzing the chart with a serious expression.

Identify Key Trends

Learn to spot major market trends, understanding their direction and strength, providing a foundation for informed trading decisions.

A close-up view of a computer screen displaying a stock chart with multiple candlestick patterns, support and resistance lines drawn on it. The chart is illuminated with different colors, showcasing key areas of interest. A hand is pointing at a specific pattern on the chart.

Recognize Patterns and Levels

Discover how to identify common chart patterns, support and resistance levels, and utilize them to predict potential price movements and enter trades strategically.

A professional trader sitting in front of multiple computer screens, actively monitoring live market data. The screens display various charts with real-time price movements and trade orders. The trader is focused and confidently executing trades based on market structure analysis.

Execute Intraday Strategies

Master intraday trading strategies based on market structure analysis, aiming to capture quick profits by leveraging identified trends, patterns, and support/resistance levels.

Unlock Quick Gains with Market Structure: Learn to Trade for 1:5, 1:10 Risk Reward

A modern, minimalist trading room with a large monitor displaying a detailed chart of a stock market index.  The chart is highlighted with lines and annotations indicating key support and resistance levels, trend lines, and patterns.  The room is lit by natural light and has a sleek, professional feel.  A trader is sitting at a desk, intently studying the chart, with a laptop and coffee cup nearby. The overall image should convey a sense of focus and precision in analyzing market data.

Mastering Market Structure

This course empowers you to analyze market trends, patterns, and support/resistance levels to gain a deeper understanding of market behavior and identify potential trading opportunities.

A colorful, dynamic visualization of a stock market chart with various indicators overlaid. The chart depicts a strong upward trend with a clear breakout pattern. The breakout point is highlighted with a green arrow and labeled with the words "Buy Signal". The background of the image should have a sense of energy and movement, conveying the excitement of capturing potential gains.

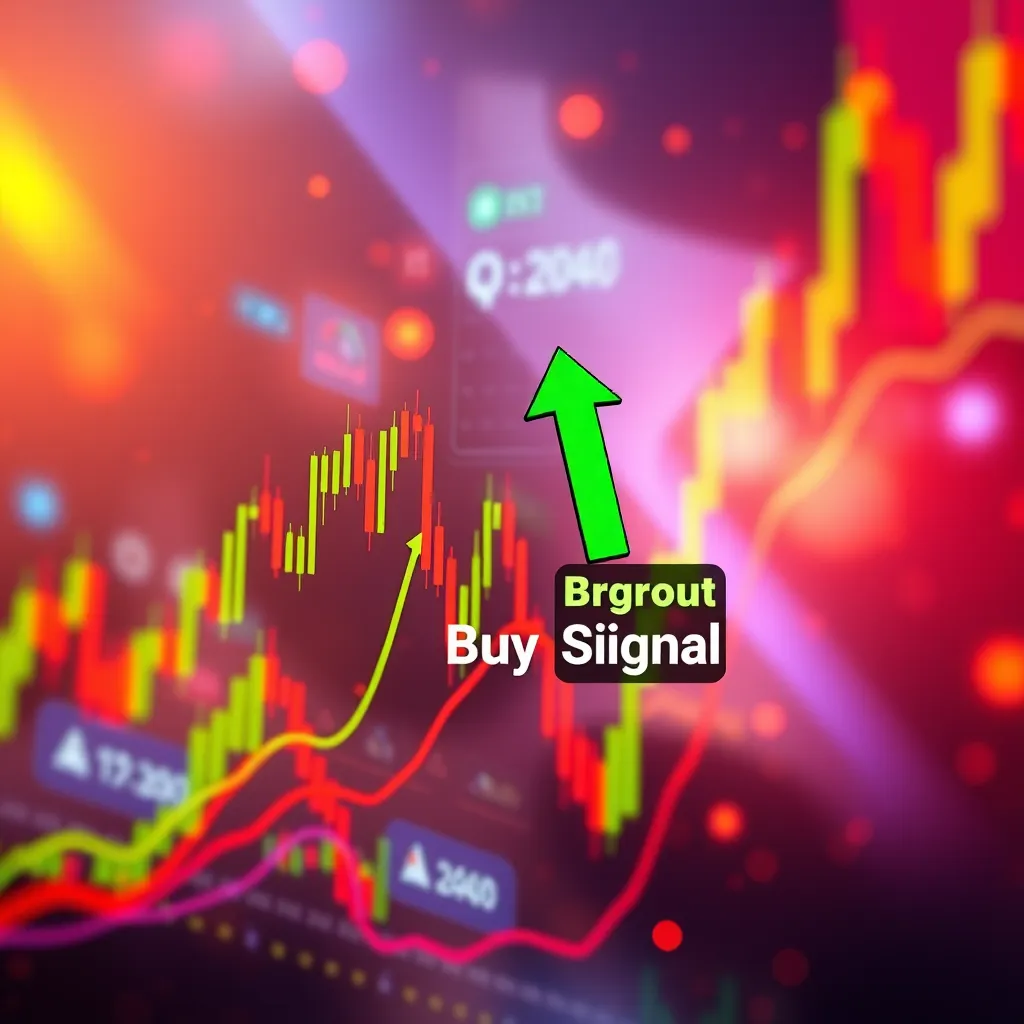
Identifying High-Probability Trade Setups

Discover how to identify and execute profitable intraday trading strategies based on market structure analysis. Learn to recognize key patterns and signals that indicate potential price movements.

A simple, clean illustration of a stock market chart with a specific trade setup.  The chart shows a price movement with a defined entry point, stop-loss level, and target price.  The numbers 1:5 and 1:10 are prominently displayed on the chart, signifying the favorable risk-reward ratios achievable with this strategy.  The background of the image should be light and airy, representing a positive and successful outcome.

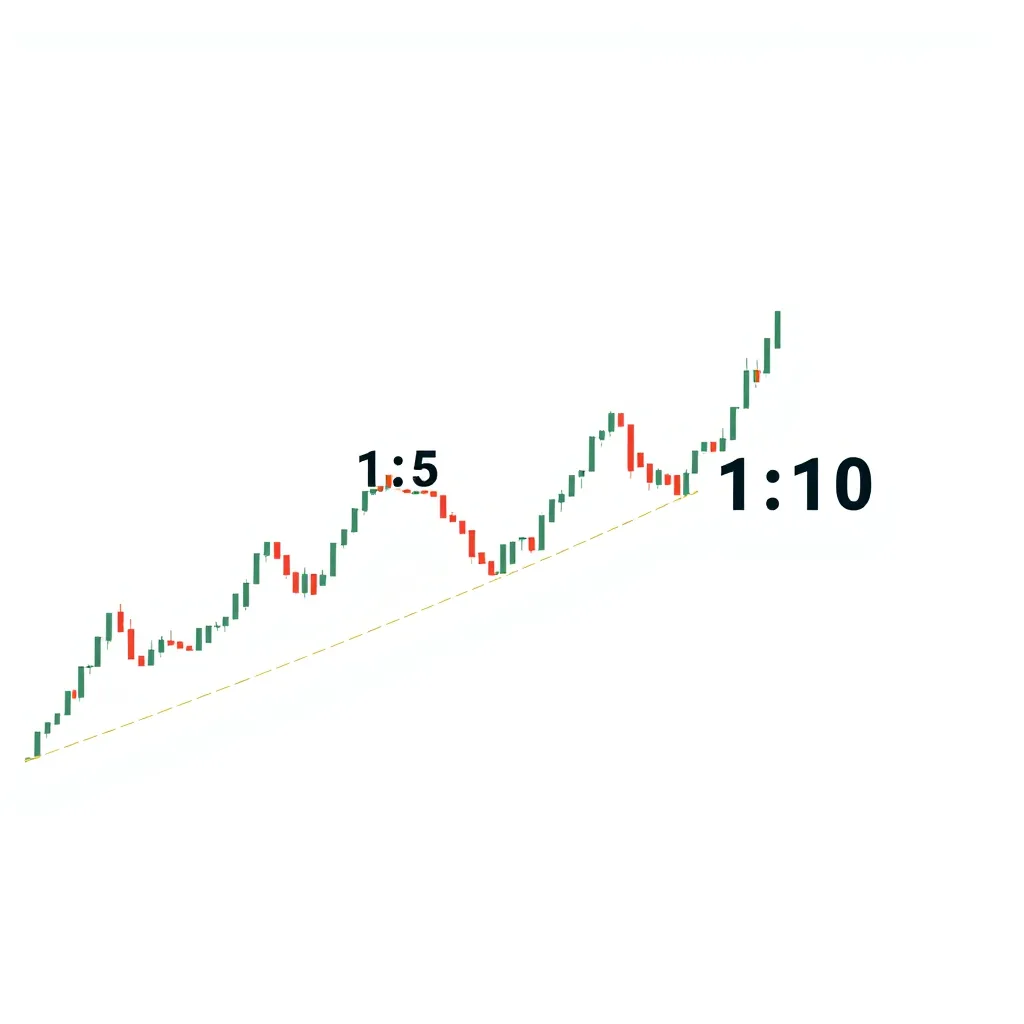
Achieving 1:5, 1:10 Risk Reward

Learn to manage your risk effectively and maximize your potential rewards with risk-reward strategies tailored for intraday trading. The course teaches you to set stops and targets based on market structure analysis, minimizing losses and maximizing potential profits.

Dominate the Day: Discover Proven Strategies for Trading Index, Options, Crude, Forex, and Crypto

A minimalist infographic showing a financial chart with highlighted support and resistance levels, price patterns, and trend lines. The background is a gradient of blue and white, symbolizing the dynamic nature of the market. The title 'Market Structure Analysis' is prominently displayed on the top.

Master Market Structure

Learn to identify key trends, patterns, and support/resistance levels to make informed trading decisions throughout the day.

A close-up shot of a trader's hands on a computer keyboard, with a large monitor displaying a live financial chart. The trader is wearing a suit and has a focused expression. The chart displays multiple indicators and trend lines, with a highlighted area indicating a profitable trade setup.

Execute Profitable Intraday Strategies

This course equips you with the skills to identify profitable trading opportunities and execute trades with confidence using proven intraday strategies.

A 3D bar chart illustrating the concept of risk-reward ratio. The chart shows two different trades, one with a small profit and high risk (short bar) and the other with a larger profit and lower risk (tall bar). The title 'Risk-Reward Management' is displayed above the chart.

Maximize Risk-Reward Ratio

Discover techniques to manage risk effectively and optimize your trades for high-reward opportunities, aiming for a favorable 1:5 or 1:10 risk-reward ratio.

Don't Miss Out! Huge Savings on Your Trading Education

Worth Rs 34,9999/-

Limited Time Offer 

Original Price Rs 19,999 

Today get it for Rs 4,999/- Only 


Massive Price Drop

For a limited time, we're offering a significant discount on our trading course, making it more accessible to everyone.

A photorealistic image of a large, bold price tag with 'Rs 34,9999/-' crossed out and 'Rs 4999/-' written in a prominent font. The background could be a blurred image of a cityscape, symbolizing the bustling financial world.

Act Now!

This offer won't last forever, so don't miss your chance to get the best price on our comprehensive trading education.

A photorealistic image of a countdown timer with 'Time Remaining: XX:XX:XX' displayed prominently. The background could be a cityscape with a large, digital clock overlayed, emphasizing the time-sensitive nature of the offer.

Learnfinity HUb: Mastering Intraday Trading

A close-up image of a trader's hands on a high-resolution, multi-monitor setup, displaying live market data charts and indicators.  The charts should show a clear example of a breakout pattern, with support and resistance levels clearly marked. The trader is intently studying the charts, with a focused expression and a finger pointing to a crucial price point. Soft ambient lighting casts a warm glow on the workspace.  The background is blurred, suggesting a bustling trading floor environment. The image should be rendered in a photorealistic style with a high level of detail, showcasing the complexity and intensity of intraday trading.  Focus on the textural details of the monitors, the keyboard, and the trader's hands, creating a sense of realism and immersion. Emphasize the vibrant colors and dynamic lines of the market data, creating a visually captivating and informative image.

Market Structure Analysis

Learn to identify key market trends and patterns for informed trading decisions.

A dramatic image of a cityscape at night, with towering buildings illuminated by bright city lights. A large, transparent screen in the foreground displays real-time stock market data, showing a chart with a bullish trend and a series of successful trades marked with green arrows.  The screen is positioned at a slight angle, with the city skyline reflected in its glossy surface.  The image should have a dynamic, fast-paced feel, capturing the energy and excitement of intraday trading. Emphasize the sharp contrasts between the dark city skyline and the bright, glowing screen, highlighting the crucial information presented on the chart. Render the image in a photorealistic style, focusing on the details of the screen, the vibrant colors of the market data, and the shimmering reflections of the city lights.

Intraday Trading Strategies

Discover effective intraday trading strategies for maximizing profits and minimizing risk.

A serene image of a tranquil workspace, with soft natural light filtering through a window. A trader sits calmly at a desk, reviewing a trading journal with a thoughtful expression. The desk is tidy and organized, with a laptop, a notebook, and a cup of tea, suggesting a calm and focused environment. The image should convey a sense of peace and control, highlighting the importance of discipline and mindfulness in trading. Use a soft color palette, with warm tones and muted greens, to create a soothing and calming atmosphere. Focus on the textures of the desk, the notebook, and the trader's hands, creating a sense of serenity and composure. The background should be subtly blurred, with the natural light illuminating the scene and creating a soft, diffused glow.

Risk Management & Discipline

Develop a solid risk management strategy for sustainable trading success.

Transform Your Trading Journey with Learnfinity HUb

Learnfinity HUb has been a game-changer for my Intraday Trading! The strategy is easy to use and has helped me improve my trading..

Richa K

I've been using Learnfinity HUb for a few months now and I'm impressed with the level of support I've received. The team is always there to answer my questions and help me troubleshoot any issues.

Rahul Dave

Learnfinity HUb has allowed me to focus on what matters most - I have Improved my trading and grown as a intraday trader.

Emily David

Ready to unlock your full potential? Join Learnfinity Hub today and take the first step towards your success!

© Copyright 2024